Branded Monthly Care Reports: What Your Clients Actually Want to See
What clients actually want in a monthly WordPress care report. Six sections, one-page format, and the structure that cuts churn by 20-40%.
Branded Monthly Care Reports: What Your Clients Actually Want to See
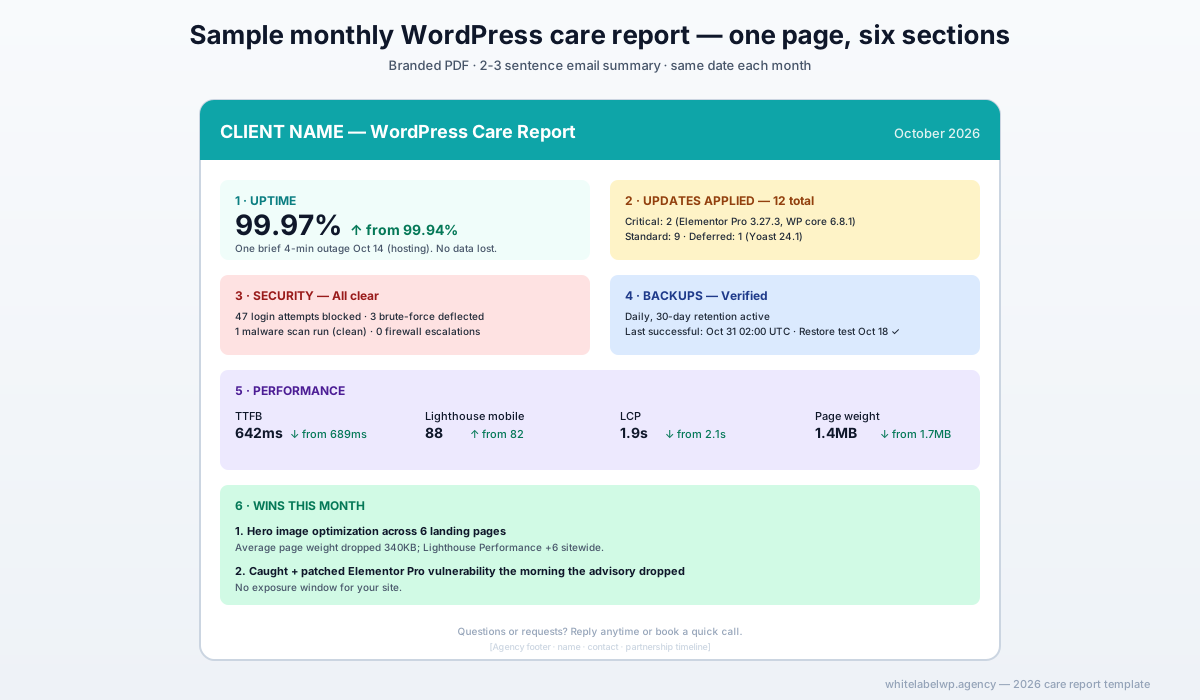
A branded monthly WordPress care report that clients actually read covers six things on one page: uptime percentage and incidents handled, updates applied (categorized by criticality), security events caught, backups verified, performance metrics with month-over-month trend, and 1-2 small wins the agency shipped that month. Length: one to two pages, not eight. Format: branded PDF, not a raw plugin export. Send on the same day each month with a 2-3 sentence email summary. Done right, monthly reports reduce care plan churn by 20-40%.
The honest read: most agencies either send no reports at all or send 8-page data dumps clients never open. Both fail for the same reason — they don’t help the client see the value being delivered.
Why monthly care reports matter (churn-prevention economics)
Care plan clients churn for one structural reason: they forget why they’re paying. The monthly invoice goes out, no specific event reminds them of the value being delivered, and after 6-12 months the question quietly forms in the client’s head — “what am I actually getting for this?”
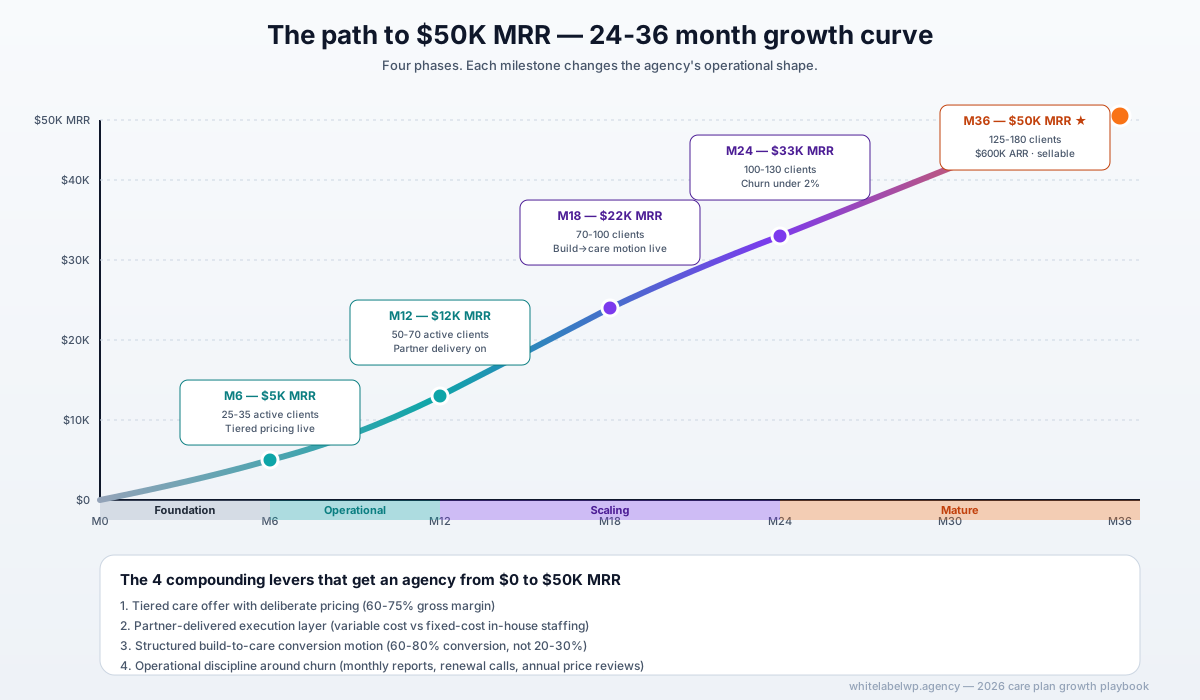
The agencies that solve this problem typically see 1-2% monthly churn. The agencies that don’t typically see 4-6%. On a $50K MRR care book, that gap is $1,500-$2,000 per month in revenue retained — $18,000-$24,000 per year.
Monthly reports are how you make the value visible. Not because clients read every word, but because the reliable arrival of a branded document tied to a real number (uptime %, updates applied) creates a sustained “they’re working on this” impression. The report is the artifact; the impression is the asset.
In our experience working with 150+ agency partners on care plan delivery, the agencies with consistent monthly reporting outperform on retention by a wide margin even when scope is identical.
The 6 sections every monthly care report should have
1. Uptime percentage and incidents handled
The headline metric. Show the percentage to two decimal places (99.97%, not “Yes uptime was good”) and any incident summary in plain English (“One brief outage on October 14 caused by hosting provider, resolved in 4 minutes with no data loss”).
Tools: UptimeRobot, Pingdom, or ManageWP’s built-in uptime monitor.
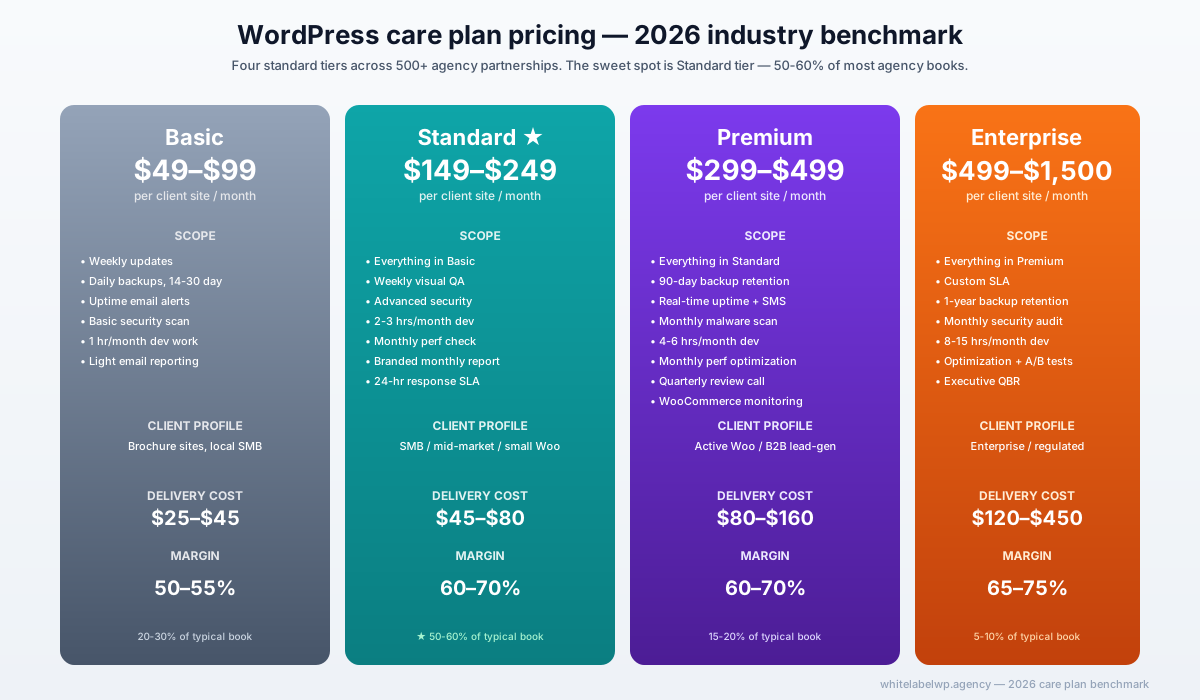
Target: 99.9%+ for Standard tier; 99.95%+ for Premium and Enterprise.
2. Updates applied (categorized by criticality)
Tell the client what was updated and why. Categorize into three buckets:
- Critical (security-driven updates): count + list of what was patched
- Standard (regular plugin/theme updates): count + summary
- Skipped/deferred: anything you chose not to update yet (with one-line reason)
This section reassures the client that updates are happening with judgment, not just being auto-applied. The “skipped/deferred” part is what builds trust — it shows you’re being thoughtful.
3. Security events handled
Brief summary of what the security layer caught. Typical content:
- Login attempts blocked (count)
- Brute-force attempts deflected (count)
- Malware scans run (count + result: clean / cleaned / pending)
- Suspicious file changes detected (count + result)
- Firewall events logged (count)
Numbers reassure. Even if the numbers are mostly “0 issues this month,” reporting them tells the client the monitoring is active.
4. Backups verified
Three pieces of information:
- Backup frequency (daily, weekly)
- Last successful backup timestamp
- Retention status (e.g., “30-day retention active, oldest backup: Oct 1”)
For Premium and Enterprise tiers, add a backup restore test confirmation (“Monthly restore test completed October 18 — backup integrity verified”). This is the difference between “we say we have backups” and “we’ve verified we can actually restore.”
5. Performance metrics with month-over-month trend
The five core metrics every report should track:
- Uptime % (already in section 1)
- Average Time to First Byte (target: <800ms)
- Lighthouse Performance score (target: 80+ for Standard, 90+ for Premium)
- Largest Contentful Paint (target: <2.5s)
- Total page weight (KB transferred per typical pageview)
Show each metric as the current value plus a small directional arrow showing month-over-month change. ↑ green for improvement, ↓ red for degradation, → for flat.
Don’t include metrics clients can’t act on or contextualize. Raw PHP memory usage, MySQL query counts, or HTTP request counts create noise without value — leave those for internal monitoring.
6. Wins from the month (1-2 narrative items)
The most underrated section. One or two short narrative items describing specific work the agency shipped that month:
- “Fixed the contact form deliverability issue that had emails landing in spam — re-tested with 5 different providers, now delivering 100%.”
- “Optimized hero image on homepage and product pages, reducing average page weight by 340KB and improving Lighthouse Performance by 6 points.”
- “Caught and patched a plugin vulnerability (Elementor Pro 3.27.2 → 3.27.3) before any exploitation.”
Two sentences per win. Concrete. Specific. No agency jargon (“alignment with stakeholder outcomes” — meaningless).
This is the section that humanizes the report. Without it, the report is data. With it, the report is “your agency working on your site.”
What NOT to include (data that confuses or scares clients)
After 1,000+ monthly reports delivered, here’s what we’ve learned to leave out:
- Raw server logs or error counts. “1,247 404 errors this month” sounds alarming without context. If the 404s are mostly bot traffic, just note the bot traffic was filtered, not the count.
- Detailed plugin lists with version numbers. Clients don’t need to see “WP Rocket 3.18.3.4 → 3.18.4.1.” They need to see “caching plugin updated to latest version.”
- Database query analysis or PHP memory profiles. Internal-only metrics. Clients don’t have the context to interpret these.
- Detailed cost breakdowns of partner delivery. The client paid you; how the work gets delivered is operationally yours, not theirs.
- “We considered doing X but didn’t because Y.” Save the internal deliberation for internal docs. Clients want to know what happened, not what didn’t.
- Long-form security advisories about non-affected vulnerabilities. “We’re aware of the WordPress 7.3 RCE vulnerability and our protections include X, Y, Z” creates anxiety without resolving it. If the site is patched, just note that updates are current.
The general principle: show what was done, show the outcome, and skip the internal mechanics.
Format that works — one-page PDF beats eight-page deck
The format matters as much as the content. Lessons from real client feedback:
One to two pages. Long enough to cover the six sections substantively, short enough that clients actually read it. Eight-page reports get filed unread. One-page reports get read at the breakfast table.
Branded PDF. Not a raw plugin export (looks unprofessional). Not a Google Doc (feels temporary). A proper PDF with the agency’s logo, color palette, and brand voice. The format signals “the agency made this for you” rather than “a tool generated this.”
Consistent layout each month. Same six sections in the same order. Predictability lets clients scan to the metric they care about most without re-orienting each time.
Branded email with 2-3 sentence summary. Don’t just attach the PDF — include a short summary in the email body. “Your October report is attached. Uptime stayed at 99.98%, we patched a security update on Elementor, and the homepage Lighthouse Performance climbed 6 points after our image optimization work. Reach out anytime.”
Send on the same date each month. First business day of the month is a common default. The consistency matters; the specific date doesn’t.
How to automate report generation
Pure manual reporting is sustainable for 10-15 clients. Past that, it consumes too much agency time. Pure automation produces robotic reports that lose engagement after 3-4 months. The sweet spot is hybrid: 70% automated data, 30% human narrative.
The data sections (uptime, updates applied counts, security events, backup verification, performance metrics) pull from monitoring tools:
- ManageWP for update tracking and aggregated reports
- iThemes Sync for similar functionality
- Hosting-provided dashboards (WP Engine, Kinsta) for uptime and performance
- Backup plugin (BlogVault, UpdraftPlus) for backup verification
The narrative sections (wins, any context, the email summary) get written manually each month by an account manager or the agency’s care lead. Budget 10-15 minutes per client per month for this step.
For agencies running care delivery through a white-label partner, the partner typically handles both the automated data and the narrative — delivering a finished branded report to the agency’s standards each month.
How to introduce reports without overwhelming the client
If you’re rolling out monthly reports to an existing care client book that hasn’t received them before, the introduction matters. Two patterns work:
Pattern 1 — Soft launch. Send the first report with an email saying “Starting this month, we’re sending monthly care reports to keep you informed on what we’re working on. The format is one page, takes 2 minutes to scan. Let us know if any sections are useful or if you’d rather have something different.”
Pattern 2 — Anchored to renewal. Use the annual contract anniversary as the moment to introduce reports. “As part of your renewal, we’re upgrading our reporting cadence — you’ll now receive a monthly care report alongside the standard service.”
Both signal the change is a value-add, not a process change being imposed. Avoid sending reports without context — clients sometimes interpret them as the agency “trying to justify the fee,” which is the opposite of the intended effect.
Sample report template (text version)
[Agency logo + branding]

CLIENT NAME — WordPress Care Report
October 2026 · [Site URL]

UPTIME — 99.97% (↑ from 99.94%)
One brief 4-minute outage on Oct 14 (hosting provider). No data lost.

UPDATES APPLIED — 12 total
- Critical: 2 (Elementor Pro 3.27.3 security patch, WordPress core 6.8.1)
- Standard: 9 (regular plugin and theme updates)
- Deferred: 1 (Yoast SEO 24.1 — staging-tested but holding pending compatibility verification)

SECURITY — All clear
- 47 login attempts blocked
- 3 brute-force attempts deflected
- 1 malware scan run (clean result)
- 0 firewall escalations

BACKUPS — Verified
- Daily backups running, 30-day retention active
- Last successful backup: Oct 31 02:00 UTC
- Monthly restore test completed Oct 18 — backup integrity verified

PERFORMANCE
- TTFB: 642ms (↓ from 689ms)
- Lighthouse Performance (mobile): 88 (↑ from 82)
- LCP: 1.9s (↓ from 2.1s)
- Page weight: 1.4MB (↓ from 1.7MB)

WINS THIS MONTH
1. Optimized the hero image across 6 key landing pages. Average page weight
   dropped 340KB; Lighthouse Performance improved 6 points sitewide.
2. Caught and patched the Elementor Pro vulnerability the morning the
   advisory dropped. No exposure window for your site.

QUESTIONS OR REQUESTS? Reply to this email anytime, or book a quick
call at [agency booking URL].

[Agency footer: name, contact, partnership timeline]
Adapt freely to the agency’s brand. The structure is what matters.
Where White Label WP Agency fits
We generate monthly care reports under the agency’s brand for client sites we deliver care plans on. The agency sets the visual template, delivery channel, and brand voice; we handle the data collection, narrative writing, and on-schedule monthly delivery. Most agencies that use partner-generated reports save 3-5 hours per month on internal reporting time and report higher client retention as a downstream effect.
Our care service includes monthly reporting as standard scope across all tiers. The care pricing breakdown covers what each tier’s report typically includes. For the broader strategy on building a care plan book to scale, see our $50K MRR care plan pillar.
Book a partner call if reporting is currently a bottleneck on your care delivery.
Frequently asked questions
What should a monthly WordPress care report include?
Six sections on one page: uptime percentage with any incident summary, list of updates applied (categorized as critical, security, minor), security events caught (login attempts blocked, malware scans completed), backup verification status, performance metrics with month-over-month trend, and 1-2 small wins the agency shipped (a fix, an improvement, a content update). Length: 1-2 pages max. Format: branded PDF. Send same date each month with brief email summary.
How often should I send WordPress care reports to clients?
Monthly is standard. Less frequent (quarterly) makes clients feel disconnected and increases churn. More frequent (weekly) creates noise and signals over-management. The discipline is in the consistency, not the frequency — same day each month, same format, same delivery channel. Clients prefer predictability over volume.
Should care reports be automated or manually written?
Hybrid. Data sections (uptime, updates, backups, security events) should pull from monitoring tools automatically. Narrative sections (the “wins” and any strategic context) should be manually written. Fully-automated reports feel robotic and lose engagement after 3-4 months. Fully-manual reports drain agency time and create inconsistent delivery. The sweet spot: 70% automated data + 30% human narrative.
How do monthly reports affect care plan churn?
Significantly. Agencies that send consistent branded monthly reports typically see 20-40% lower churn than agencies that don’t. The mechanism is straightforward — clients forget why they’re paying when they don’t see ongoing value; reports keep the value visible. Reports also create a recurring touchpoint that prevents the “should we keep paying for this?” question from becoming an active decision.
What metrics should I show in a WordPress care report?
Five core metrics: uptime percentage (target 99.9%+), average response time (target under 800ms TTFB), Lighthouse Performance score (current vs prior month), security incident count (blocked + handled), and dev hours used vs included. Include the metric as a number plus a directional arrow (up/down/flat) showing month-over-month trend. Avoid metrics clients can’t act on or contextualize (raw PHP memory usage, MySQL query counts) — they create noise without value.
Can a white-label partner generate care reports under our agency’s brand?
Yes. White Label WP Agency generates monthly care reports under the agency’s brand, format, and delivery cadence. The agency sets the visual template and delivery channel; we run the data collection, format the report, and send it on schedule each month. Most agencies that use partner-generated reports report 3-5 hours/month saved on internal reporting time.